Time-Sync - Measurement
Prepare Software
Prepare Host
The Host PC will
control the devices via the ssh-sessions
record the sync-performance with a logic analyzer connected to each sheep (Saleae Software)
stress-test sheep and network with workloads (iperf3 is needed, available via apt)
Prepare nodes
This involves
choosing and installing linux-image
configure PTP & phc2sys
cleaning up the system to reduce interrupts
activating the kernel-module to trigger the gpio
Tests require 2 to 3 embedded systems running linux
advantage of 3: one node can be ptp-server, the others are clients
the server can have a sync-offset on hardware-level
Devices are connected to a dhcp network (network under test)
BeagleBone Black
Follow the shepherd installation guide Timing-Output is generated by PRU by default and needs modification of KernelModule-Code.
BeagleBone AI64
Steps are described in AI64-Eval-Document
Raspberry CM4
Steps are described in CM4-Eval-Document
Kernel-Module Modification
There are two specialized branches to GPIO-Access on Kernel-Level
Kernel510: allows direct gpio-access for BBone Black & AI64
Kernel61RPi: same for Raspberry PI CM4
⇾ compile and install these
Set up Hardware
After having the software ready there are three steps for getting the hardware ready for the measurements:
get all nodes on the same network
Try to model the future network
route power to each system
special reqs. are noted below
POE-Adapters are always a good idea
get the logic analyzer connected to the gpio-trigger-output
connecting the ptp server to pin 0 of the analyzer is recommended, as it might show a difference in behavior
don’t forget to also connect ground
Quick-HowTo for the Saleae logic analyzer
channel-numbers are printed on the bottom-side
the removable connector-leads are color-coded and also have the channel-number printed on the individual ends
all ground-cables are black & without a channel-number printing
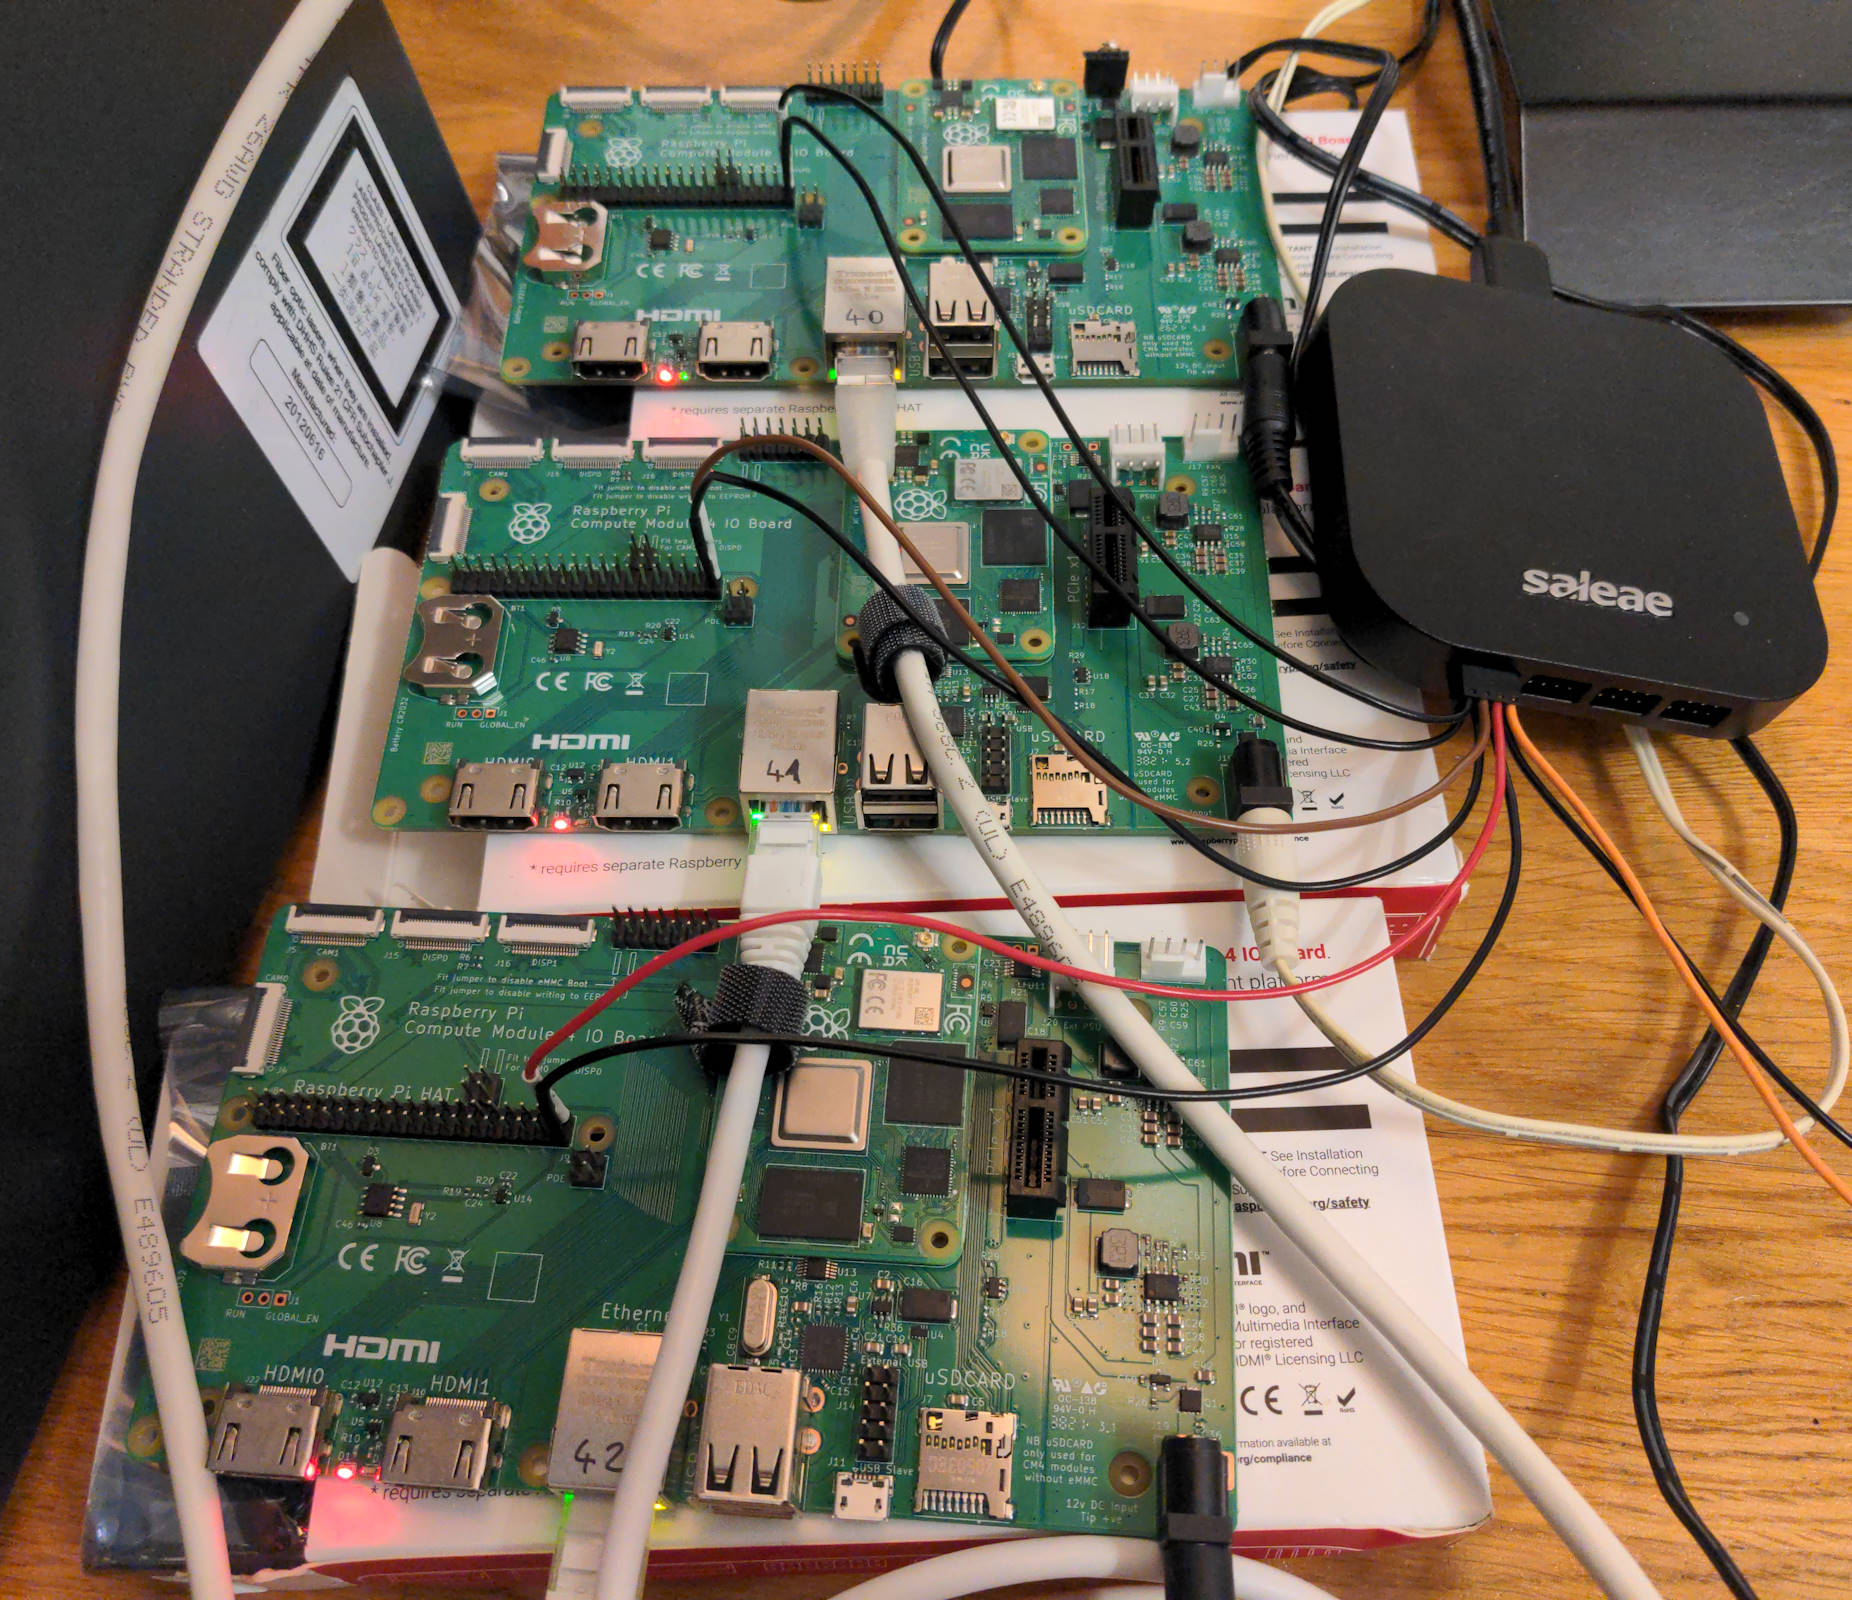
Raspberry Pi CM4
power via barrel connector can be 7 - 27 V and defaults to 12 V
current draw is typically < 150 mA @ 12 V, can increase under load, but is < 500 mA
signal-pin is the uppermost right on the main connector
ground reference is right below signal
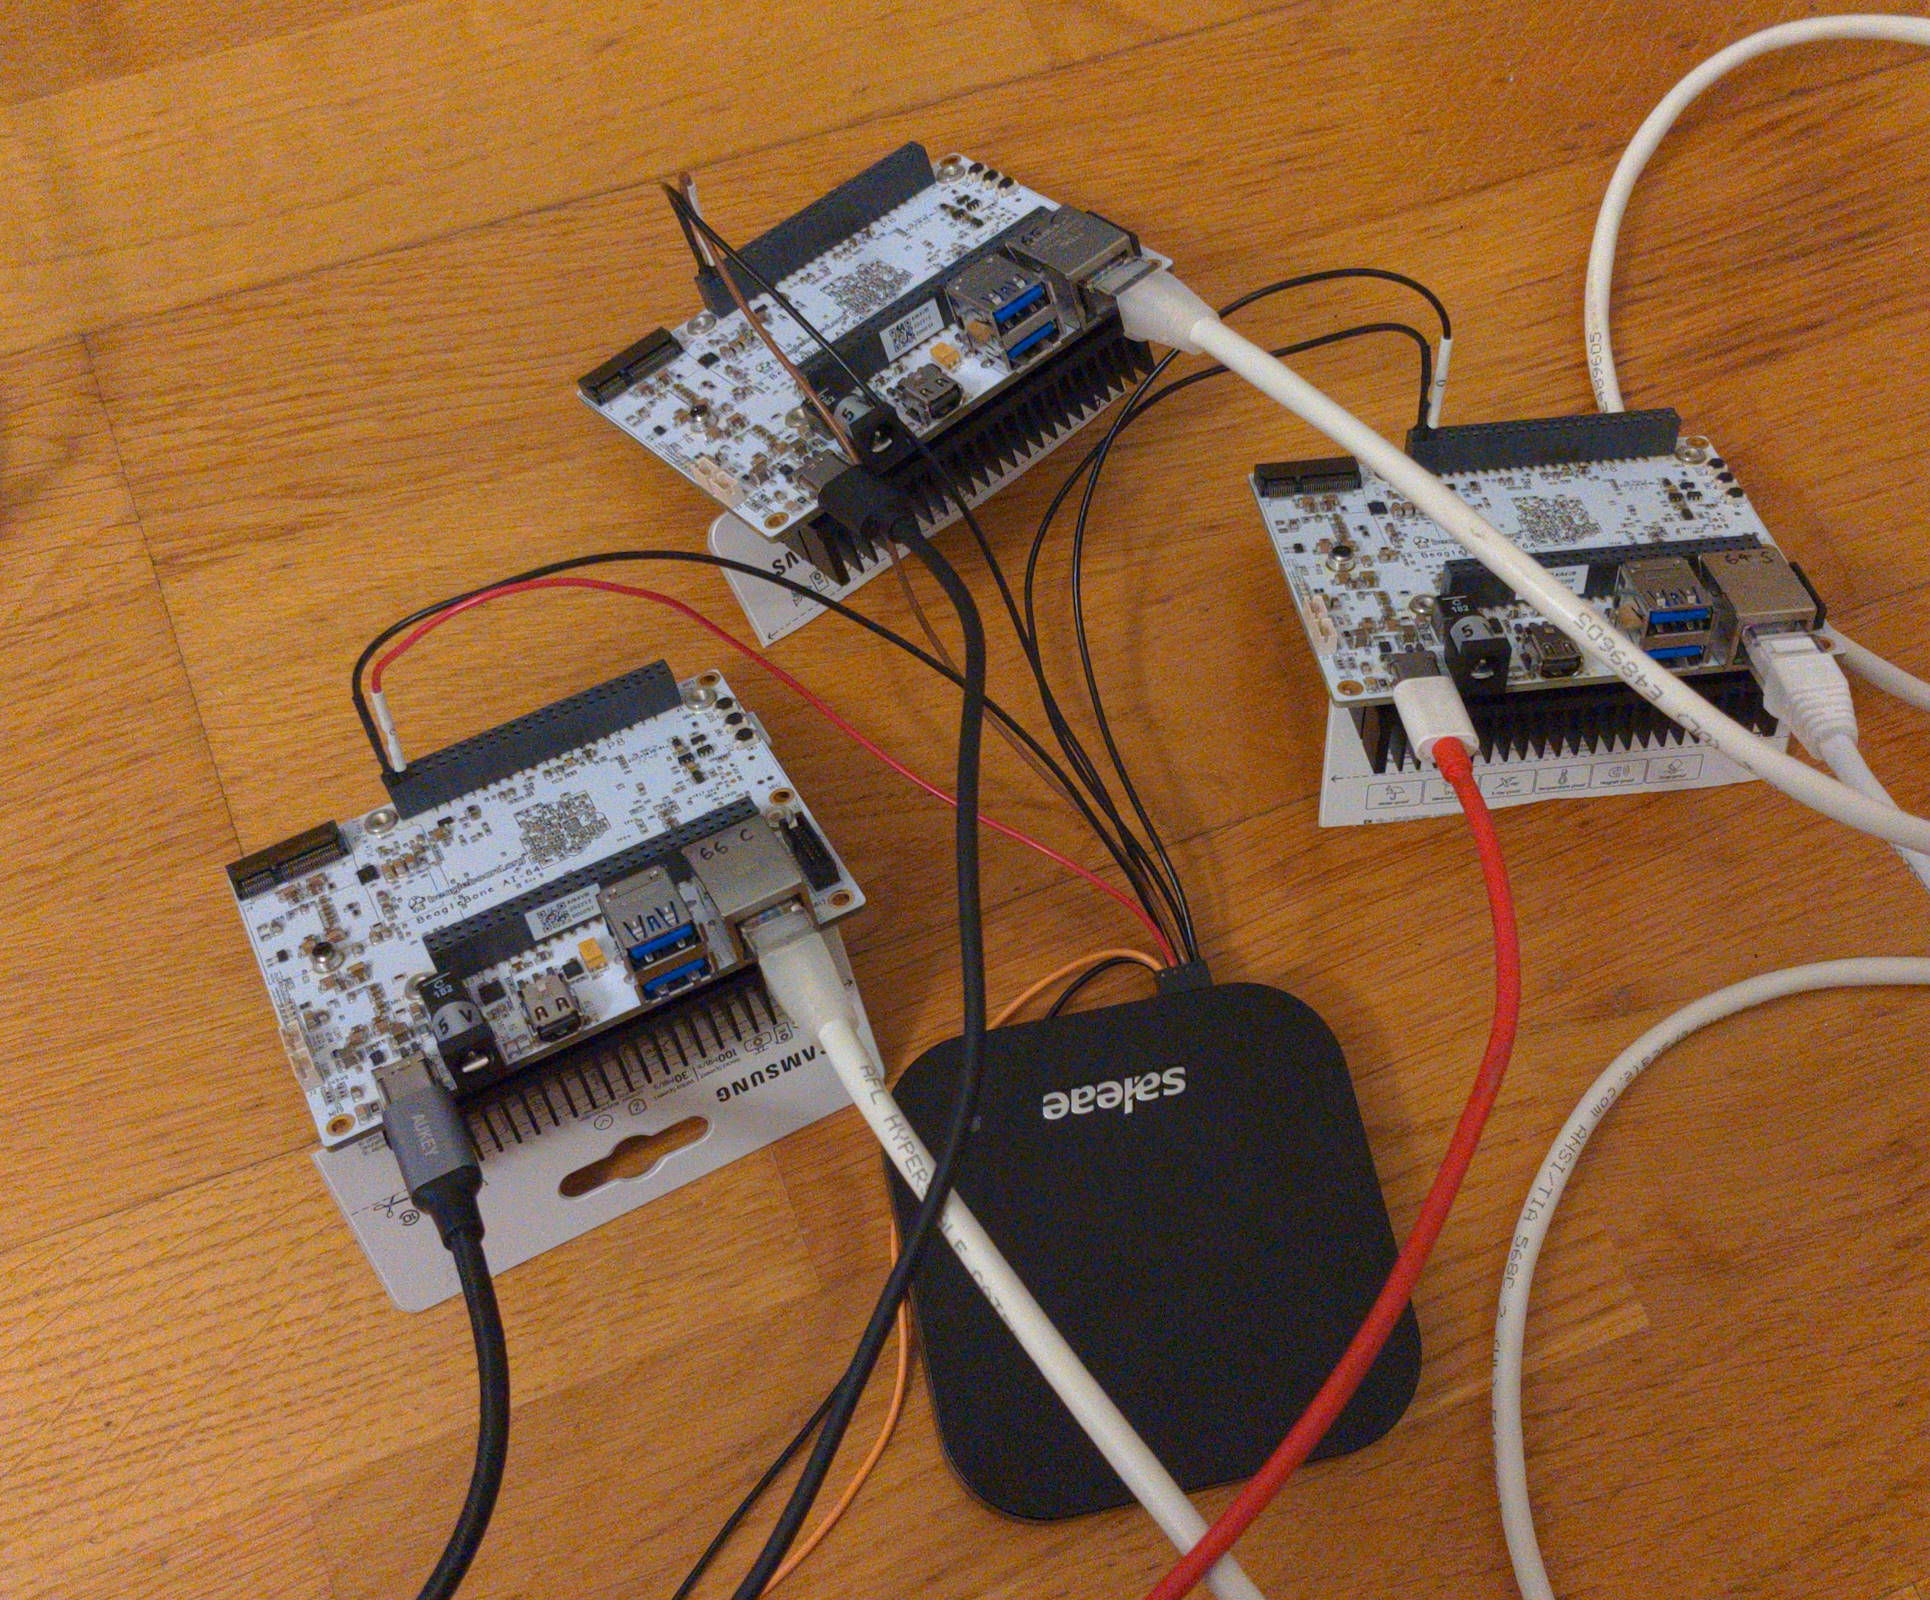
BBone AI64
power via USB Type C is fine
be sure to give the heatsink some air - the system can crash from heat
signal-pin is the second from left on the lower row on P8
ground reference is left from signal, in the lower left corner
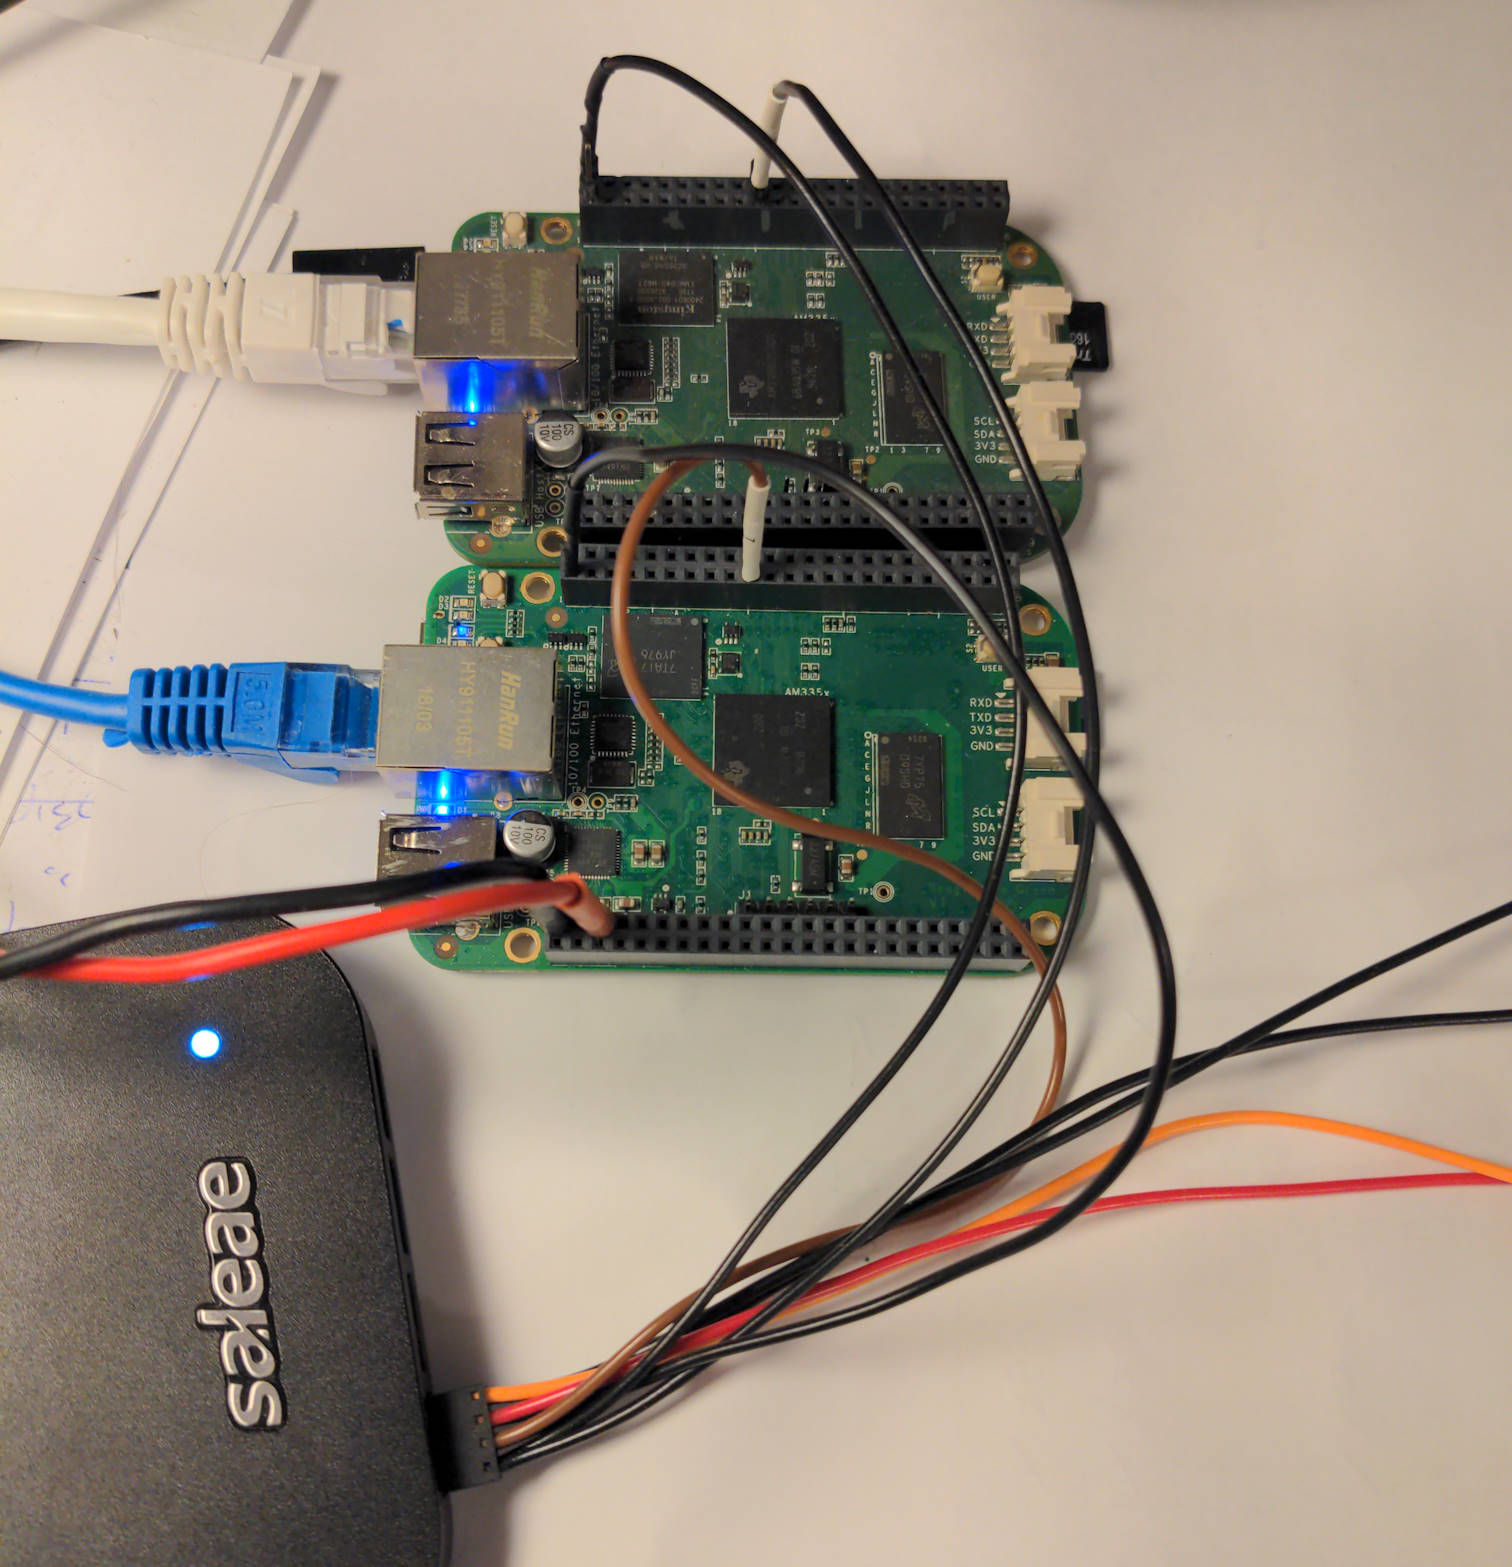
BBone Black
Small introduction into beaglebone
orientation: ICs / CPU visible, ETH-Connector facing left so the white font (silkscreen) on PCB is readable
there are two large connectors P8 on top, P9 on bottom. each has 46 pins, with pin 1 in the lower left corner - compare with silkscreen
P8 is our main-connector for the test. Pin 1 & 2 (left-most) are ground / GND
NOTE: there are (small) white markers on the PCB that indicate start of a decade
Connect logic analyzer to each sheep
GND goes to P8-01 or P8-02
Channel wire goes to P8-19 for the kernel-output
for debug another channel can be hooked up to P8-28 (pru-output)
Measurement
Preparation
set up hardware and software according to steps described above
check that ptp is working
option 1: via logic analyzer (see subchapter below)
option 2: via ssh-connection (commands below)
PTP should be given >= 5 minutes to stabilize
room-temperature should be stable, as clock-crystals react to that
Note for RPi CM4
Changing the governor to performance does not always work during boot, please check. At least the ptp-server is mostly stuck on ondemand.
# check
cpufreq-info
# reset
sudo cpufreq-set --governor performance
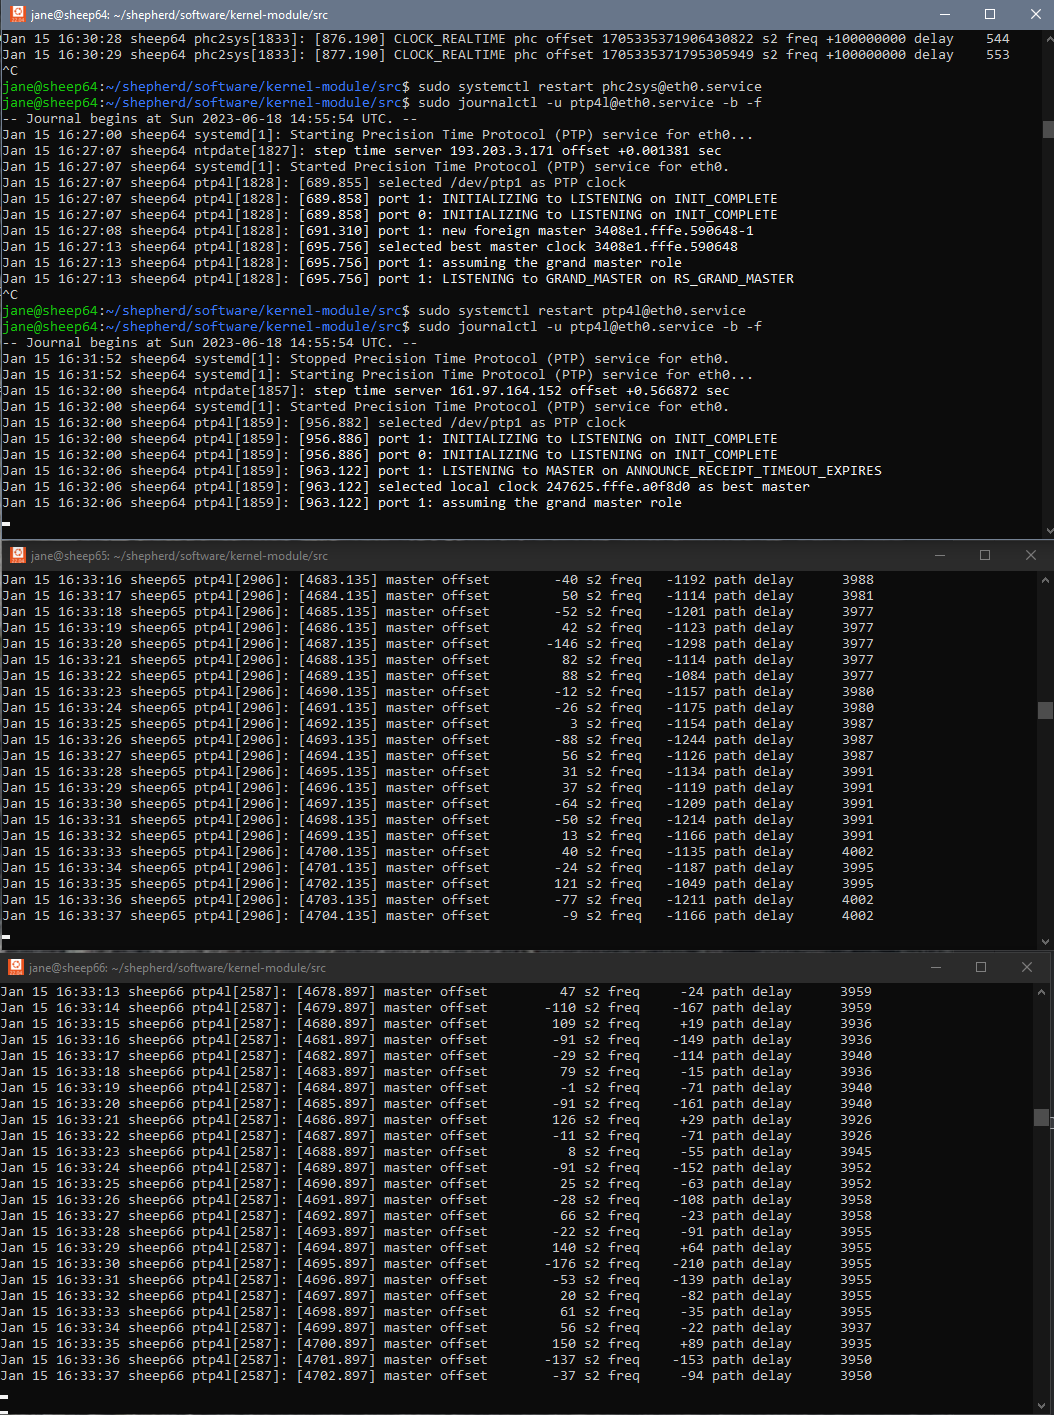
Quick-HowTo for Sync-Services
Current state of PTP can be checked on the nodes with
sudo journalctl -u ptp4l@eth0.service -b -f
sudo journalctl -u phc2sys@eth0.service -b -f
Fixing time-sync problems can be solved be restarting the services and shepherd-kernel-module
# note: if ptp is restarted, phc must also be restarted
sudo systemctl restart ptp4l@eth0
sudo systemctl restart phc2sys@eth0
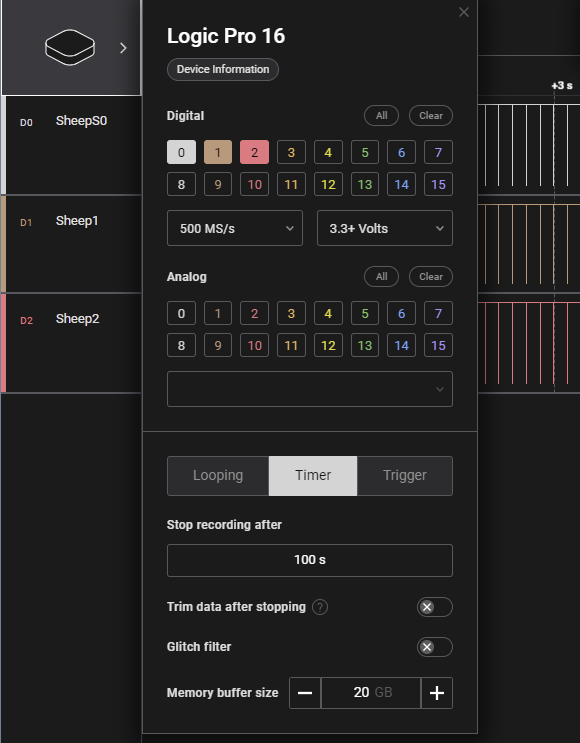
Quick-HowTo for Logic 2 Software
config under
Device Settings(device-shaped symbol in top left corner of plot)select connected channels -> usually
0 to 2(Digital, NOT Analog)select highest samplerate ->
500 MS/sselect highest voltage-levels ->
3.3+ Voltsset
Timerto record for100 s(and stop automatically after that)
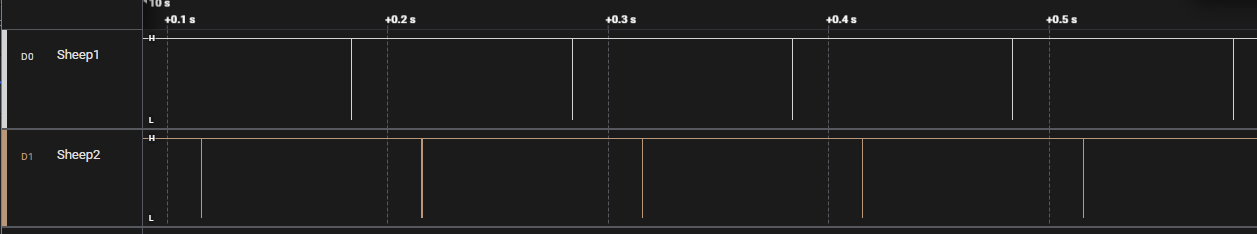
a failed sync looks like that:
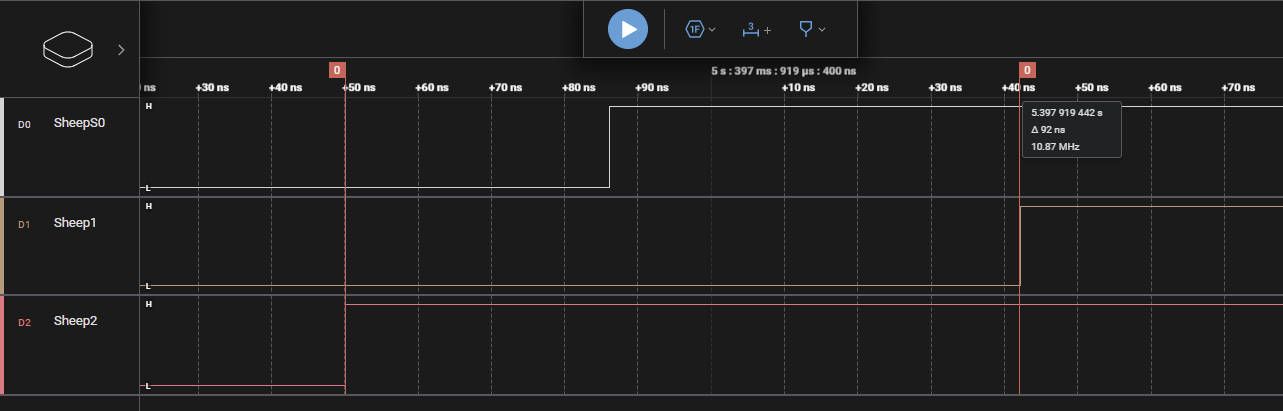
a successful sync shows minimal delay between the rising edges of each node, seen here with 92 ns as largest distance
Don’t forget to save the capture after each measurement with a meaningful name, i.e. 01_baseline.sal!
Quick-HowTo for IPerf3
IPerf3 can be used to generate network traffic.
sudo apt install iperf3

# mockup server: device receiving data
iperf3 -s

# ptp-clients send, here 100Mbit to server-IP for 10 s
iperf3 -b 100M -c 10.0.0.200
The server can only receive data from one client at the same time. Therefore the two ptp-clients should be used in alternating pattern. It’s best to start the recording first, then begin with traffic and alternate for ~ 50 - 70 s. The recording should show ~ 20 s of ptp getting back to normal at the end.
Collecting the Data with Logic 2 Software
It’s recommended to separate different campaigns and hardware-setups by subdirectories. A small textual description can help for later analysis. Notes of oddities and reported ptp path delays add valuable context.
The following measurements are recommended
01 - baseline (stable, undisturbed network)
02 - ptp-clients send data to external host with 100 Mbit/s
03 - ptp-clients send data with 200 Mbit/s
04 - ptp-clients send data with 400 Mbit/s
05 - ptp-clients send data with 800 Mbit/s
06 - ptp-clients receive data from external host with 100 Mbit/s
07 - ptp-clients receive data with 200 Mbit/s
08 - two external hosts send at max rate
Each running for 100 s.
Analysis
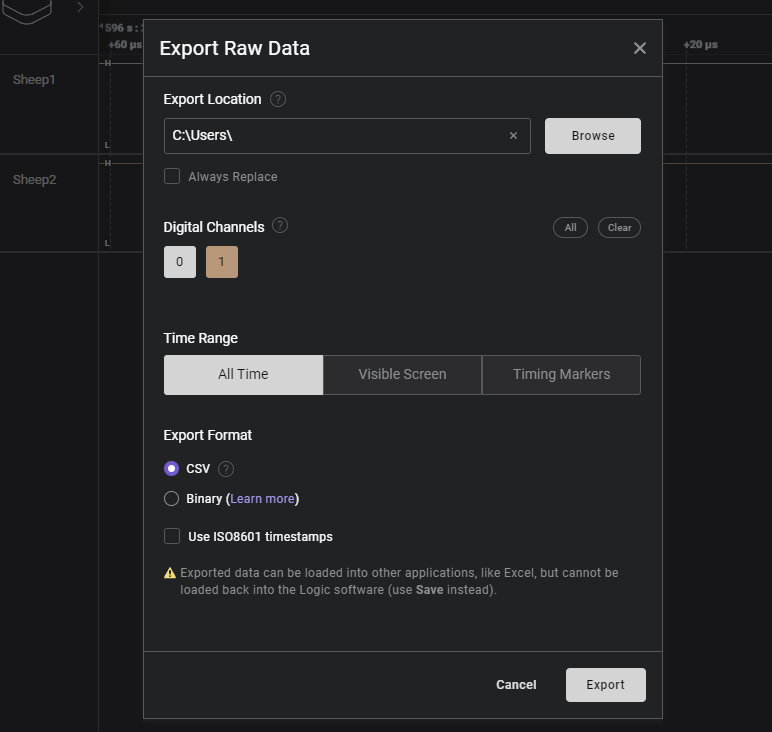
Prepare Data
Logic 2 Software -> File -> Export Data
select channels: 1-3
Time Range: All Time
Format: CSV
DON’T use ISO8601 timestamps
Export and rename file to meaningful description
Processing Data
See the dedicated tool-page or an exemplary analysis